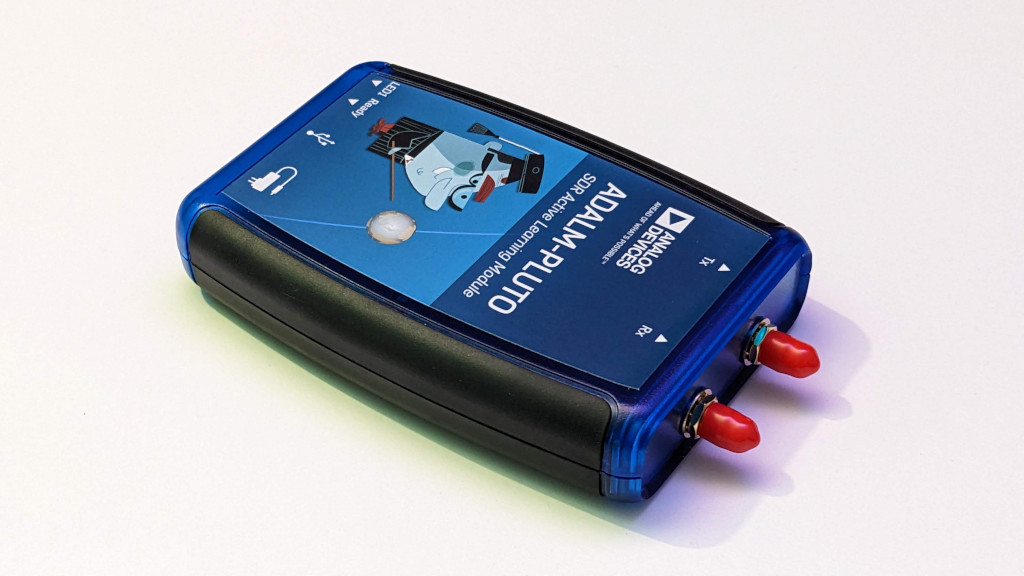
In this post I am going to document using the modified 2 channel Pluto SDR Radio and saving the data to a SigMF file, which includes both the original data and the meta data describing the capture that has taken place.
The first task is to install the tools that are required for the capture and saving the file to the disk.
import sys
!{sys.executable} -m pip install pyadi-iio
!{sys.executable} -m pip install sigmf
The common tools that I will need for carrying out the processing I plan to do, numpy is for working with the number, while matlibplot is used for plotting the samples we capture and datetime is used to get the current time and date from the system
import matplotlib.pyplot as plt
import numpy as np
import datetime as dt
ADI provides the link to the analog devices Pluto Software Defined Radio (SDR) that will be providing samples, for this example it will be provided over the local network using an Ethernet adapter to connect to it.
import adi
SigMF is used for storing the samples collected, this allows for them to be processed at a later date
import sigmf
from sigmf import SigMFFile
from sigmf.utils import get_data_type_str
Setup the Pluto SDR get the samples from, as the Pluto SDR here has been modified to allow the use of both the channels to receive data so I make used of the ad9361 part of the package and enable both channels
sdr = adi.ad9361("ip:192.168.0.130")

samp_rate = 20e6

sdr.rx_enabled_channels = [0, 1]
sdr.sample_rate = int(samp_rate)
sdr.rx_rf_bandwidth = int(20e6)
sdr.rx_lo = int(2422e6)
sdr.rx_buffer_size = int(01.e6)
sdr.gain_control_mode_chan0 = "manual"
sdr.gain_control_mode_chan1 = "manual"
sdr.rx_hardwaregain_chan0 = int(20)
sdr.rx_hardwaregain_chan1 = int(20)
Capture a buffer of samples, these complex IQ values are then placed in a list, for the two channels.
samples = sdr.rx() # receive samples off Pluto
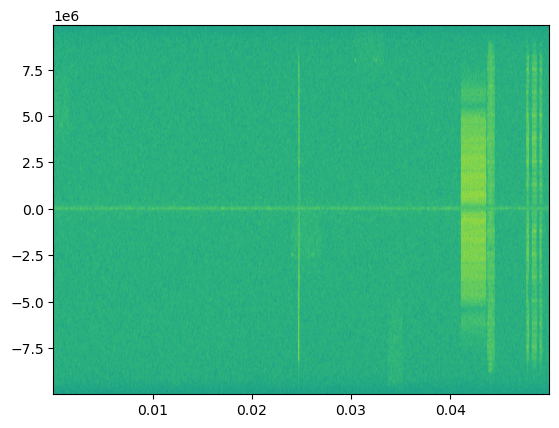
The first channel can then be plotted as a spectrogram using matplotlib and the specgram function to help visualize the signals that are captured as part of the signal.
plt.specgram(samples[0][:], Fs=sdr.sample_rate)
plt.show()

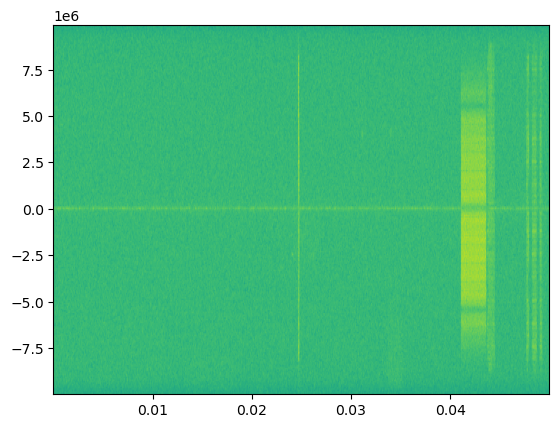
And the same can be done for the other channel to confirm we can see similar signals on both the channels
plt.specgram(samples[1][:], Fs=sdr.sample_rate)
plt.show()

Saving the capture to a SigMF file so that the captured values can be used again later. The SigMF file consists of a binary data file that contains the raw samples captured from the SDR, then the second file contains the meta data that describes the capture, this includes details such as sample rate, frequency and a description of the file that has been created. This standard is designed to help make the captured files more useable. For the purpose of this capture we are only saving the results from 1st channel of the SDR Capture.
# get the samples from the radio
values = np.asarray(samples[0][:]) # receive samples off Pluto

# write those samples to file in cf32_le
values.tofile('my_capture.sigmf-data')

# create the metadata
meta = SigMFFile(
    data_file='my_capture.sigmf-data', # extension is optional
    global_info = {
        SigMFFile.DATATYPE_KEY: get_data_type_str(values),  # in this case, 'cf32_le'
        SigMFFile.SAMPLE_RATE_KEY: sdr.sample_rate,
        SigMFFile.AUTHOR_KEY: 'jjhorton@gmail.com',
        SigMFFile.DESCRIPTION_KEY: 'An example data capture from Pluto SDR.',
        SigMFFile.VERSION_KEY: sigmf.__version__,
    }
)

# create a capture key at time index 0
meta.add_capture(0, metadata={
    SigMFFile.FREQUENCY_KEY: sdr.rx_lo,
    SigMFFile.DATETIME_KEY: dt.datetime.utcnow().isoformat()+'Z',
})

# check for mistakes & write to disk
meta.tofile('my_capture.sigmf-meta') # extension is optional
With the file captured the next steps will be to look at extracting data and information from the raw IQ data and then add them as annotations to the raw data. With this type of future processing it should be possible to start identifying the signals and labeling them in them file.
