After seeing a post on twitter where someone was experimenting with the AMG8834 sensor, and I wanted to give it a go. This sensor can be purchased preassembled on breakout boards, ready to drop into a breadboard and build a system around.
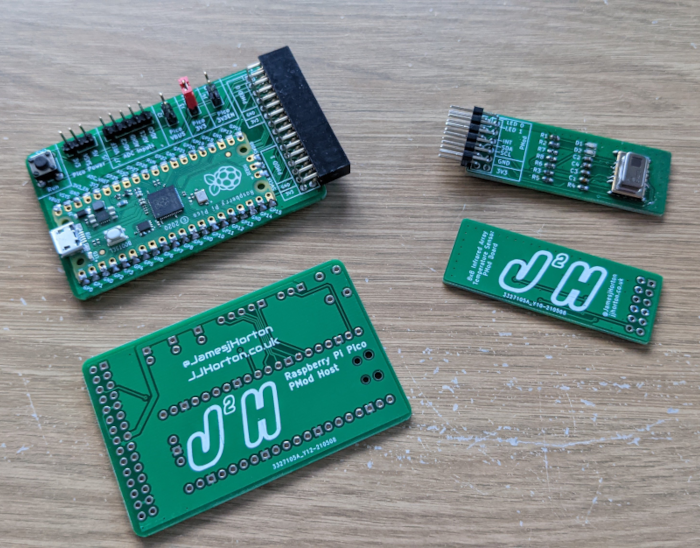
While I could build something around these breakout boards, I decided to take a different route and have a go at building one of my own boards. for the connector I wanted to use a PMod, as this would allow me to use the board with both my Raspberry Pi Pico Boards that I just made, as well as the iceBreaker FPGA board I already own, and maybe in the future I may have a go with getting it working with my Zynq based Cora Z7 board. This makes the PMod connector an excellent solution for my small prototypes, to be able to move between these types of boards.
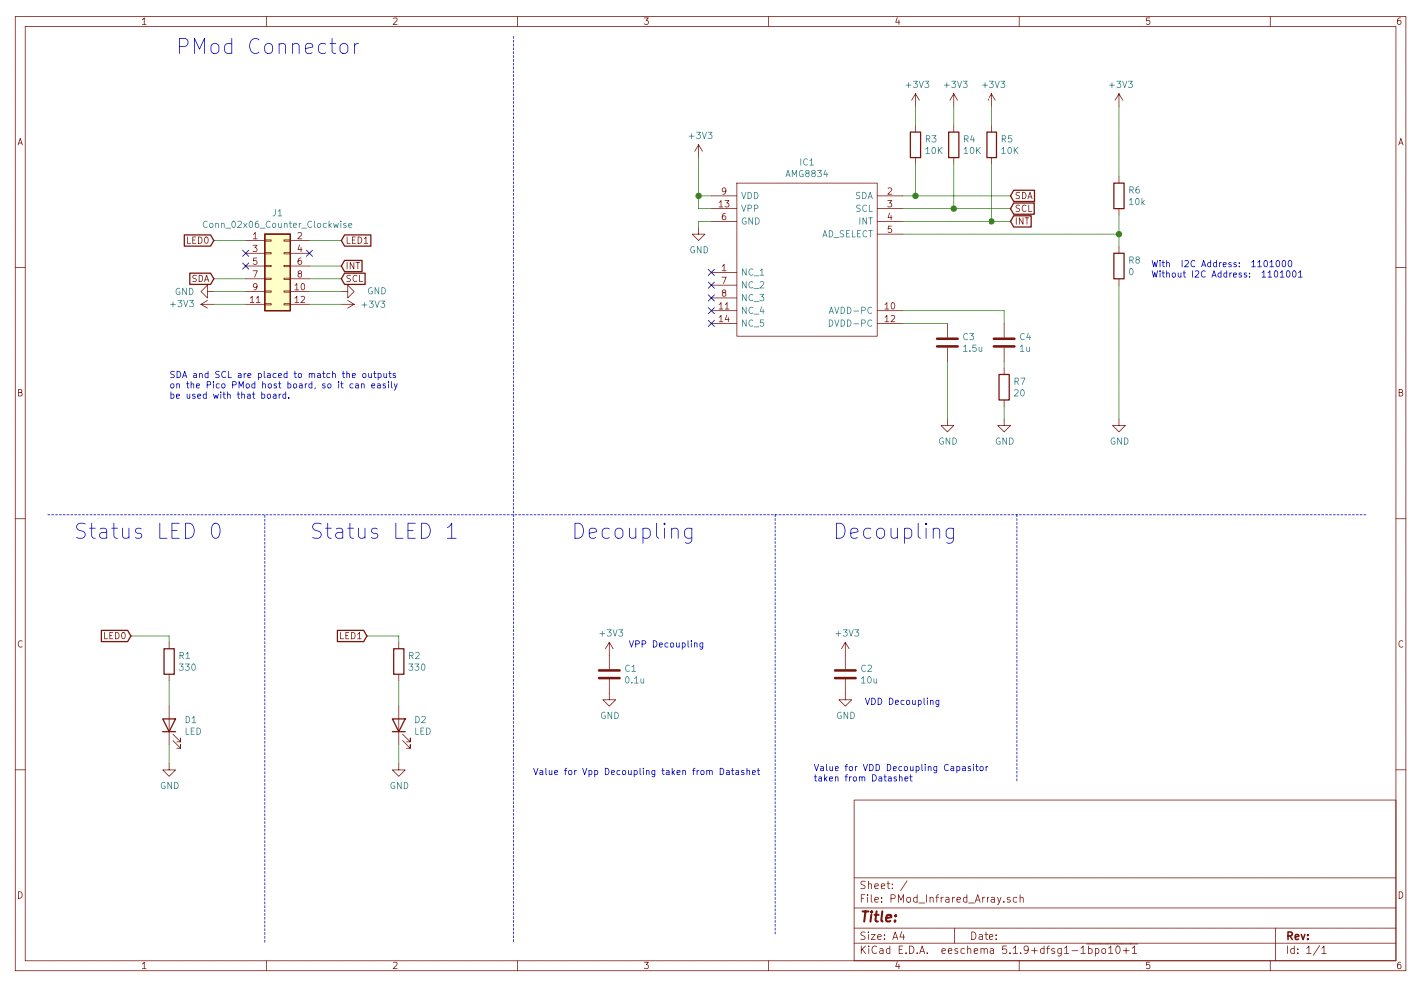
For building my breakout board, I use KiCAD, and the process of building this board is as simple as copying the design as given in the sensors datasheet, the circuit required is very simple and helps minimise any potential errors. the main effort was ensuring that the i2c interface pins match up with the available i2c pins on the Raspberry Pi Pico PMod board connector. Once that is done its just a case of order the PCB and waiting for it to turn up in the post.
The sensor output is an 8x8 array of values, which refresh at a maximum rate of 10Hz, so my initial solution to test this sensor out is to stream it over the Raspberry Pi’s serial interface Back to my Computer where I will plot the result.
To get started I took some of the code from the Raspberry Pico C/C++ examples, and used that to work out how to get the pins setup to work with i2c on the pins that I needed. I really like using the PIO, as it gives you a lot of flexibility, although it is taking a bit of getting used to.
stdio_init_all();
// This example will use I2C1 on the SDA and SCL pins (2, 3 on a Pico)
i2c_init(i2c1, 1000000);

//Setup the I2C pins
gpio_set_function(2, GPIO_FUNC_I2C);
gpio_set_function(3, GPIO_FUNC_I2C);
gpio_pull_up(2);
gpio_pull_up(3);

// Make the I2C pins available to picotool
bi_decl(bi_2pins_with_func(2, 3, GPIO_FUNC_I2C));
The reading of the pixel values turned out to be more simple than I was expecting, with the addr of the sensor being set with the hardware configuration int addr = 0b01101000;. For getting the values, we just write position of the first value, and then just keep reading the two bytes, which contain the 14 bit values for the pixel, 64 times. Each time we have read a value, we convert it to a floating point value and scale it using the value 0.25, which was given in the datasheet for the sensor.
//read the pixel values
val = 0x80;
i2c_write_blocking(i2c1, addr, &val, 1, true);

for(int i = 0; i<63;++i){
	ret = i2c_read_blocking(i2c1, addr, &rxdata[0], 2, true);
	if(i%8 == 0){
		printf("\n");
	}
	float result  = (int16_t)((((uint16_t)rxdata[1] << 8) | ((uint16_t)rxdata[0]))<< 4) >> 4;
	printf("%6.2f, ", 0.25*result);
}
The printf function is then just printing to the serial interface, where we will be picking them up on the PC that is connected to it.
For plotting the values from the Pico we are using a simple python script running on a PC, for that we have a number of dependancies, which we will first import.
import numpy as np
import matplotlib.pyplot as plt
from scipy import interpolate
import serial
We then need to setup the serial link, so that we can receive the output from the Raspberry Pi Pico on my MacBook, at this point we also initialise the my_results array where we will be storing the values, along with a counter.
ser = serial.Serial('/dev/tty.usbmodem1101', 115200 ,timeout=1)
my_result = np.zeros([8,8],dtype=np.float32)
my_counter = 0
Next up we need to setup the figure that we will plot the results in, for this we are using matplotlib, we are going to set the colourbar range to be from 0 to 40 degrees with vmin=0, vmax=40 , as this the range I’m expecting to see when testing it out.
fg = plt.figure()
ax = fg.gca()
h = ax.imshow(my_result, vmin=0, vmax=40,cmap=plt.get_cmap('inferno'))
plt.colorbar(h)
Now we are ready to enter our main program loop, so that this runs indefinitely i’m using a while(1) statement to keep it looping round. This is then followed by the ser.readline() command, which should hopefully get us an string containing 8 comma seperated values from the Raspberry Pi Pico. To check it is likley the values we are expecting we check the length, if its long enough to be our values, we seperate the values using split(",") function, and convert the values to be a np.float32 datatype.
while(1):
	my_data = ser.readline()

  if len(my_data) > 20:
		my_string = str(my_data)[3:-7]

		my_result[my_counter,0:8] = np.asarray(my_string.split(","),dtype=np.float32)
		my_counter = my_counter + 1
Now we have a line of numbers, once we have 8 of them we now have all the image. This mean we need to update the plot that we created earlier with the values received from the sensor, before reseting our counter back to zero.
	if my_counter > 7:
		h.set_data(np.fliplr(np.flip(my_result)))
		plt.draw(), plt.pause(1e-4)
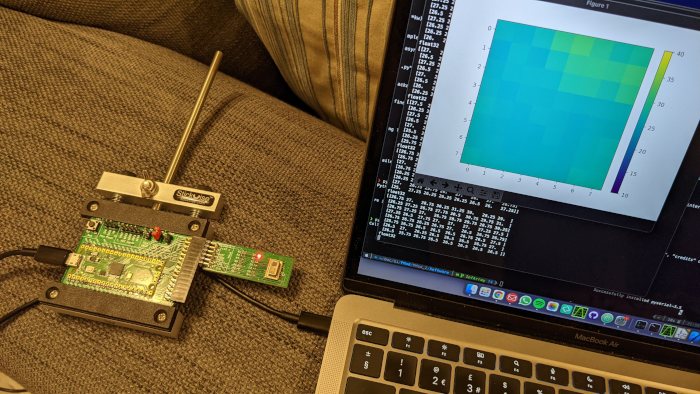
This then allows us to see what the sensor is seeing, which I was really happy with when I checked out that my solution actually worked the morning after writing the code.
A quick test this morning to confirm I did get my AMG8834 thermal sensor working with the Pico, although given the time the files were last edited last night I might need that energy drink soon #electronics #rppico #rp2040 #LateNight pic.twitter.com/bSTmoAp1lP
— James Horton (@JamesjHorton) June 11, 2021
With that now completed, my next task is to look at getting an identical example in HDL which uses either the Icebreaker Board or the Colorlite i5, this will be a bit more of a challenge, but it will be a great little project for improving my HDL coding skills.