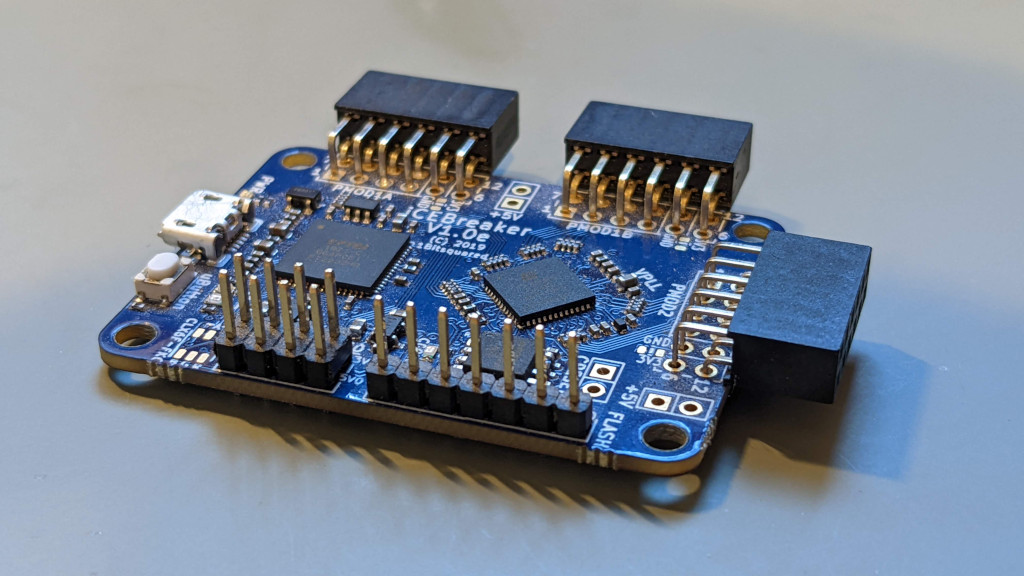
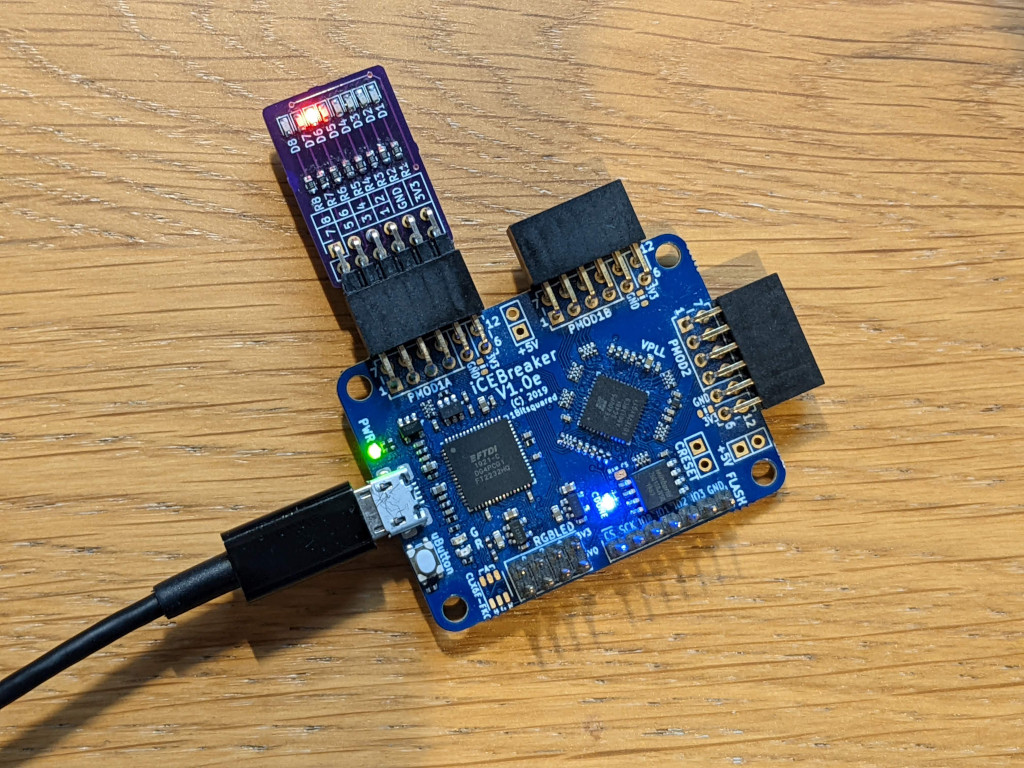
I was looking to build a simple flashing LED example using my IceBreaker FPGA Board, for this I wanted to build on CI tools I set up before, and add some more useful testing to my setup. First of all lets look at what we are aiming to build, the PMOD board has 8 LED’s each connected to a single pin, setting the IO pin high turns the LED on. With one LED on at a time, cycling though all the LED’s one at a time at a speed which is easily slow enough to see. From this desription we can build up a picture of what we want our system to output.
The first task is to build up a clock divider, this takes in the clock that is avlible on our icebreaker board, and then creating a much slower clock. The clock on the iceBreaker FPGA is 12MHz, and we need to bring this down, the code bellow implements a counter in verilog which counts up to 1+2^23. With this running at 12MHz should take the board ~0.7 seconds to count upto, this is a much better speed for the user to be able to see on the board, if we then trigger our code when the counter is reset.
`default_nettype none

module blinky(CLK);
	input 	wire 			CLK;

	parameter 	WIDTH=25;
	reg 	[WIDTH-1:0]		counter;

	initial counter = 0;

	always @(posedge CLK)
	begin
		counter <= counter +1'b1;

		if (counter[WIDTH-1] == 1)
		begin
			// When the counter reaches top value reset it
			counter <= 0;
		end
	end

endmodule
We can then setup the code to drive an LED, for this we are going to an an output LED, which is a an 8 bit output which will be mapped to the PMod connector. The display parameter is used to store the value that will disaplyed, this is initalised with a value of 8'b00000001 and then is binary shifted to the left each time the counter is reset, so after the first time the counter results in 8'b00000010, and getting our required output, as the value it 8 bits wide once the value reaches 8'b10000000 it will wrap round to our origonally value, and start again from zero. The complete function is shown bellow.
`default_nettype none

module blinky(CLK, LED);
	input 	wire 			CLK;
	output 	wire 	[7:0]	LED;

	parameter 	WIDTH=25;

	reg 	[WIDTH-1:0]		counter;
	reg 	[7:0]			display;

	initial counter = 0;
	initial display = 8'b00000001;

	always @(posedge CLK)
	begin
		counter <= counter +1'b1;

		if (counter[WIDTH-1] == 1)
		begin
			// When the counter reaches top value shift the LEd accross one
			counter <= 0;
			if (display== 8'b10000000)
				display <= 8'b00000001;
			else
				display <= display << 1;
		end
	end

	assign LED = display;
endmodule
With the code written the next plan is to test it, with a simple design like this it is easy to test on hardware but I was looking to use a simulation to help check everything is working, for this I’m going to be using verilator. The first check we can do is a lint check, this allows me to confirm that the syntax in my design is correct using verilator, without actually simulating our design:
verilator --lint-only -cc blinky.v
Verilator also allows you to build test benches using C++ that drive your verilog design, this appeals to me as i’ve been working with more C programming latley, so it works for me. Here is the code that I am using:
#include <stdio.h>
#include <stdlib.h>
#include "Vblinky.h"
#include "verilated_vcd_c.h"
#include "verilated.h"

void tick(int tickcount, Vblinky *tb, VerilatedVcdC* tfp){
	tb->eval();

	if(tfp)
		tfp->dump(tickcount * 10-2);

	tb->CLK = 1;
	tb->eval();
	if(tfp)
		tfp->dump(tickcount * 10);

	tb->CLK = 0;
	tb->eval();
	if (tfp) {
		tfp->dump(tickcount * 10 + 5);
		tfp->flush();
	}
}

int main(int argc, char **argv){
	Verilated::commandArgs(argc, argv);
	// Instantiate the design
	Vblinky *tb = new Vblinky;

	unsigned tickcount = 0;

	//generate a trace
	Verilated::debug(0);
	Verilated::traceEverOn(true);
	VerilatedVcdC* tfp = new VerilatedVcdC;
	Verilated::mkdir("logs");
	tb->trace(tfp, 99);
	tfp->open("trace.vcd");

	for(int i=0; i<(4*8*3); i++){
		tick(++tickcount, tb, tfp);
	}

	//write the coverage data out
	VerilatedCov::write("logs/coverage.dat");

}
There are two functions here, a tick function and the main function, the main function is were all the intresting stuff happens. The main function can be split into the following core functionality:
- Instantiate the compiled design with
Vblinky *tb = new Vblinky;which pulls our design as a C++ object fromVblinky.hwhich we imported at the start - We then initalise our tick counter,
unsigned tickcount = 0;with this we count the number of clock cycles our design has completed - There are then a series of verilator settings that are set up, this are to provide out logging to a VCD file and output for coverage data
- Next up is our main loop,
for(int i=0; i<(4*8*3); i++)for each loop we are just running our tick function,tick(++tickcount, tb, tfp);this function creates the tick on the input. - Once the loop has created the number of clock cycles we need, we just write out the logged data with
VerilatedCov::write("logs/coverage.dat");this is so we have some coverage data.
With our program for testing our simple design, we now just need to run this code, but we need to run it with some specific inputs, and then run the resulting executable.
verilator -Wall -GWIDTH=3 --trace --build --coverage -cc --exe blinky.v test.cpp
./obj_dir/Vblinky
There are a few key flags that we are setting up here in the verilator command:
-GWIDTH=3This allows us to override the width parameter, in the case of this simulation we are reducing it from 25 in our design to 3 in the simulation, this is important to us, because otherwise in the example we would need to run a very long simulation where nothing happens for long periods. When what is needed in the simulation is to look at the transitions.--traceThis allows the simulation to output the tracevcdfile for our design, this will be how we confirm what is taking place inside our design.--buildThis tells verilator to build our test bench which is input astest.cpp, including compling our verilog design using verilator into the c++ object our test bench interacts with--coverageThis tells verilator that we want to output the details for coverage, and it needs to keep those values
With the last coverage command we also need to run another command to get the coverage data out in a useful format, such as html and in a text file:
verilator_coverage logs/coverage.dat --annotate logs/annotated --write-info logs/coverage.info --write logs/results.txt --rank
genhtml logs/coverage.info --output-directory logs/html
lcov --list logs/coverage.info > logs/coverage.txt
This type of data is really useful for the CI tools, that I am setting up for this design. This is because the coverage gives an indication of how much of my verilog design is actually being tested in my test bench, in terms of how much of my code is actually being called. For this simple design the coverage stats are very simple and do not provide much insight, but confirm we are testing all of out design.
Reading tracefile logs/coverage.info
            |Lines       |Functions  |Branches
Filename    |Rate     Num|Rate    Num|Rate     Num
==================================================
[/]
blinky.v    | 100%     15|    -     0|    -      0
==================================================
The next task is how we start to pull all these different components together into a Continuous Integration solution that can be run on each change to the repo. The setup for the Github action for running these tests in very standard and I run on the ubuntu system.
name: "PMod LED"

on:
  schedule:
    - cron: "0 8 * * 1"

  pull_request:
    paths:
      - '.github/workflows/Leds.yml'
      - 'PMod_LED/Firmware/**'

jobs:
  Build-Firmware:
    runs-on: ubuntu-latest
    steps:
      - name: Checkout Code
        uses: actions/checkout@v2
        with:
          path: project
Installing verilator on the current version of ubuntu is an issue as I need a newer version, thankfully a version is avalible from the sifive repo for ubuntu, which can be installed once all the required depenancies are installed using apt, which is shown bellow.
      - name: Install verilator tools
        run: |
          sudo apt-get install git perl python3 make autoconf g++ flex bison ccache
          sudo apt-get install libgoogle-perftools-dev numactl perl-doc
          sudo apt-get install libfl2
          sudo apt-get install libfl-dev
          sudo apt-get install zlibc zlib1g zlib1g-dev
          sudo apt-get install lcov
          wget https://github.com/sifive/verilator/releases/download/4.204-0sifive3/verilator_4.204-0sifive3_amd64.deb
          sudo dpkg -i verilator_4.204-0sifive3_amd64.deb
Running the coverage base testing is the same as above, we just need to set the VINC veriiable before we start up
      - name: Run coverage
        working-directory: project/PMod_LED/Firmware
        run: |
          export VINC=/usr/share/verilator/include
          verilator -Wall -GWIDTH=3 --trace --build --coverage -cc --exe $(PROJ).v test.cpp
	        ./obj_dir/Vblinky
	        verilator_coverage logs/coverage.dat --annotate logs/annotated --write-info logs/coverage.info --write logs/results.txt --rank
	        genhtml logs/coverage.info --output-directory logs/html
	        lcov --list logs/coverage.info > logs/coverage.txt
Now we have the outputs from out tests and coverage data we need to think about how we make that data avalible, for me this is completed by placing it in comments of a pull request, the first one to tackle is the vcd file that we created, now we needed to get it in a format that can be posted directly into the github pull request comments, for this I am using wavedrom with its json wave formate, which is then rendered as an image in the comments. To get this done we need to convert from VCD to the specific json formate, as with most problems there is a solution avalible to make the conversion using a python script that someone else has written.
      - name: Checkout vcd2json
        uses: actions/checkout@v2
        with:
          repository: nanamake/vcd2json
          path: vcd2json

      - name: Generate plot of the waveform
        working-directory: project/PMod_LED/Firmware
        run: |
          sed -i '/^$/d' trace.vcd
          python3 generate_wave.py
This json waveform that is output can then be piped directly into a comment from the github action using just a few lines, we also add the coverage data at this point from the text file we created earlier.
      - name: Extract the test data
        working-directory: project/PMod_LED/Firmware
        run: |
          echo 'Testing Output:' >> test-results.txt
          echo -n '<img src="https://svg.wavedrom.com/' >> test-results.txt
          sed -i "s/\"/'/g" trace.json
          echo '"/>' >> trace.json
          cat trace.json | tr -d '\n' >> test-results.txt
          echo 'Coverage Stats:' >> test-results.txt
          echo '```'  >> test-results.txt
          cat logs/coverage.txt >> test-results.txt
          echo '```'  >> test-results.txt
      - name: comment test results in PR
        if: github.event.schedule != '0 8 * * 1'
        uses: machine-learning-apps/pr-comment@master
        env:
          GITHUB_TOKEN: ${{ secrets.GITHUB_TOKEN }}
        with:
          path: project/PMod_LED/Firmware/test-results.txt
The waveform that is added to the comment can be seen bellow along with the coverage data, this allows manual confirmation that the verilog code is behaving as expected without having to run the code on a local machine.
While I do like this as a quick sanity check the inclusion of the code like this is only going to useful in a limited number of circumsances. Typically where a run is quick and it is easy to do a visual test, but I do like having it avalible on simple designs like this. The coverage information is more useful, as it allows tracking of testing performance, but this could be improved if we could add a comparision on the testing performance with the master branch for pull requests.
The next step is to look at adding some of the FPGA building features, that I created last year, although I would like to add some automatic stats like this for the FPGA build.